Big Data Bowl - Identifying Difficult Passes with Deep Learning
NFL Deep Learning
Courtesy: AP Photo-Reed Hoffmann
For the UChicago Spring 2024 Machine Learning and Predictive Analytics Course I completed the following deep learning project, creating a CNN to predict pass completion rates using NFL tracking data from the Big Data Bowl. This approach largely builds off of the great work done by the 2020 winners of the Big Data Bowl, who used a CNN to predict rushing yards at the time of handoff, and Jesse Fisher’s blog post titled ‘PassNet’ which applied the same framework to offensive data in the 2021 BDB but does not include any code. As far as I know, this project is the first publicly-published code that uses a CNN to predict completion rates.
A write-up can be found below, with the full code available here.
Introduction - Context and Available Data
In American football, quarterbacks throw the ball to their teammates to gain yards and eventually score touchdowns. Metrics to evaluate the quality of quarterbacks focus on overall results, e.g., touchdowns, passing yards, completion rate, etc. These metrics fail to capture the situational context of each throw, namely, how difficult was it to complete a pass given where the defenders/teammates were positioned at the time of release.
The NFL runs an annual Kaggle contest (the Big Data Bowl) during which they release samples of their rich tracking data to amateur data scientists. The 2023 data contains frame-by-frame information on every player’s location and speed for every camera frame of every pass in Weeks 1-8 of the 2021 NFL season. The contest prompt was focused on offensive line performance, and as such, each play’s tracking data ends roughly five frames after release.
Problem Statement and Goal of Analysis
For each throw in the dataset, I want to measure how difficult each throw is, ultimately to create a framework to determine which quarterbacks completed the most challenging throws. To do this I will utilize a convolutional neural network to determine the probability of completion of a pass at the time of each pass’s release, and use these probabilities and actual outcomes to identify the most difficult completions that were converted in the test data.
Data and Model Assumptions
Assumptions
- Spatial relationships between offense/defense/the ball are what drive pass completion success. By training a CNN on the positions/speeds of the players and ball involved in each play, I am assuming that the success of a pass attempt is driven by where the actors are on the field in relation to each other. This is a safe assumption: a pass is more likely to be completed if there are fewer defenders near the thrower and catcher, and more likely if the ball is moving in the direction of the receiver. I can train a kernel to scan over every player per play, detecting patterns in how their speed and position relate to the ball and other players around them, to learn which patterns drive high completion probabilities.
- Patterns in the data are the same no matter where they occur in the sample space. Due to parameter sharing, CNNs assume that patterns in the training set have the same impact on the target variable regardless of their location. In my context, this means that distances between certain players and others will all be treated the same. Again, this is a safe assumption. It does not intuitively matter which player is moving at which speed/direction when considering completion probability.
Hypothesis
The main hypothesis of this approach is that a CNN, typically used for image analysis, can scan over a space of player position and speed measures and detect patterns that identify whether a pass is likely or not to be completed. With a kernel of size 1, each player/player and player/ball combination of positions/speeds will be examined separately, and parameter sharing will allow the CNN to learn equally from all of those combinations.
Limitations
High accuracy/low loss will be difficult with this model. Given the nature of the problem, most pass attempts have a high amount of uncertainty when the ball is released from the QB’s hand. It will be thus be difficult to achieve overwhelmingly accuracy.
The dataset is also somewhat limited in size – only ~6900 pass attempts. This is going to make it challenging for the CNN to learn only from the movement/positional patterns to recognize open receivers, and not just learn the noise of each play’s result.
My model also doesn’t address “eligible/ineligible” receivers - not every player on the field is allowed to catch a pass by NFL rules.I hope the CNN will recognize that players close to the quarterback are rarely thrown to, and if the ball is on a trajectory toward them at release that it will go past them to a receiver.
Exploratory Data Analysis
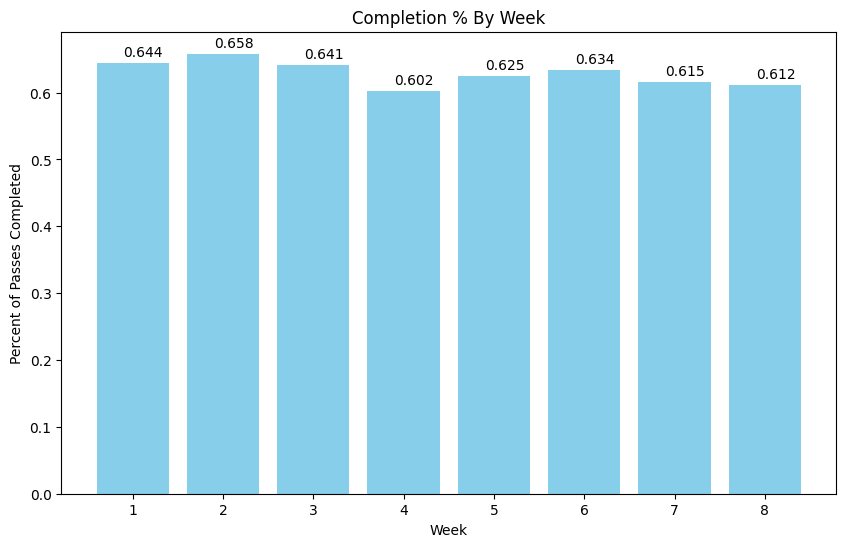
After removing penalties, sacks, and QB runs from the data, slightly over half of the pass attempts are completed. Ideally the trained CNN will have an accuracy higher than the baseline ~61% seen in the holdout weeks 7 and 8.
The data for each play can also be visualized as seen here (vizualization code taken from this awesome plotting function created by Hunter Kempf):
Each player and the ball has a position for each frame of the play, as well as a speed. I will derive their relative and positions and speeds to each other and the ball as seen on the next slide.
Feature Engineering/Transformations
First, I need to limit each play to the “time of throw.”
- I do this by filtering down to the second frame after ball release. This allows the model to learn which direction the ball is being thrown in (so it knows who the intended pass-catcher is).
Then, following the modeling framework used in the work mentioned above, I construct the following ten vector features. These vectors effectively provide a “snapshot” of player movements and positions for a CNN kernel to scan over and detect patterns.
- Offensive player positions relative to football
- Offense position (x, y) – football position (x, y)
- Offensive player speeds relative to football
- Offense speed (in x direction, in y direction) - football speed (in x direction, y direction)
- Offensive player raw speeds
- Offense speed (in x direction, in y direction)
- Defensive player positions relative to offensive players
- Defense position (x, y) – offense position (x, y)
- Defensive player speeds relative to offensive players
- Defense speed (in x direction, in y direction) - offense speed (in x direction, y direction)
I also translate every frame to augment the data.
- This flips the y direction of every play and should add generalizability to the model, as it learns that the y-direction of the movements/distances does not matter.
Initial Modeling Approach
My CNN inputs the 4-dimensional data outlined above (play, offensive players, defensive players, measures) to predict the binary outcome of a pass being completed.
The model architecture has two blocks of convolutional layers to learn patterns corresponding to players’ relative positions and speeds to the other team and the ball:
- The first block has three 2D convolution layers with kernel size (1,1) and stride size (1,1). This block iterates over every pair of offense and defensive players and learns from each pair’s relative positions and speeds.
- I then pool across the defensive player dimension.
- After pooling, the second block has three 1D convolution layers with kernel and size strides = 1. This block learns patterns about offensive players’ speed and positions (both raw and relative to the ball).
After pooling again, I use two dense layers with “relu” activation functions, and then a final dense layer with sigmoid activation function to output probabilities of pass completion.
I apply a dropout rate of .3 before the output layer to discourage overfitting and implement batch normalization throughout to improve training stability and performance.
I use pass plays from weeks 1-6 of the 2021 season as my training data and implement three-fold CV for model testing.
Initial Approach – Checking for Over/Underfitting
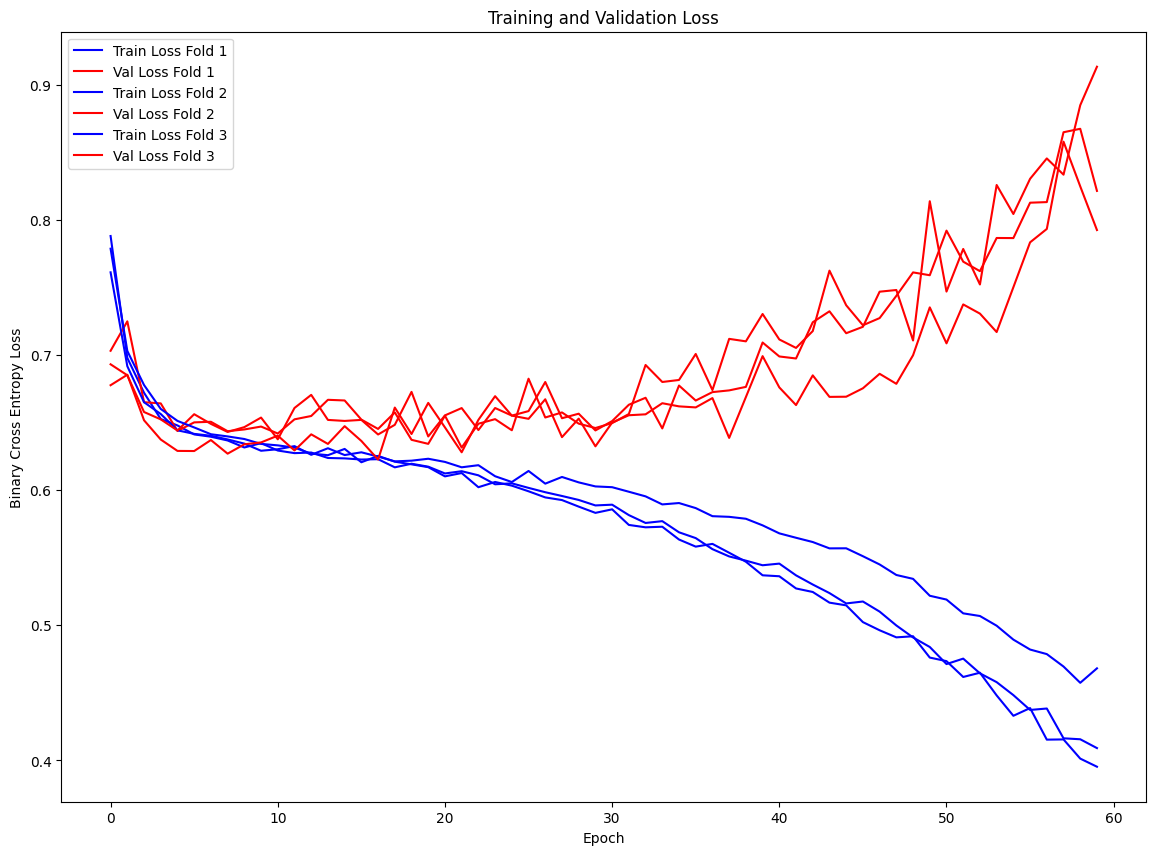
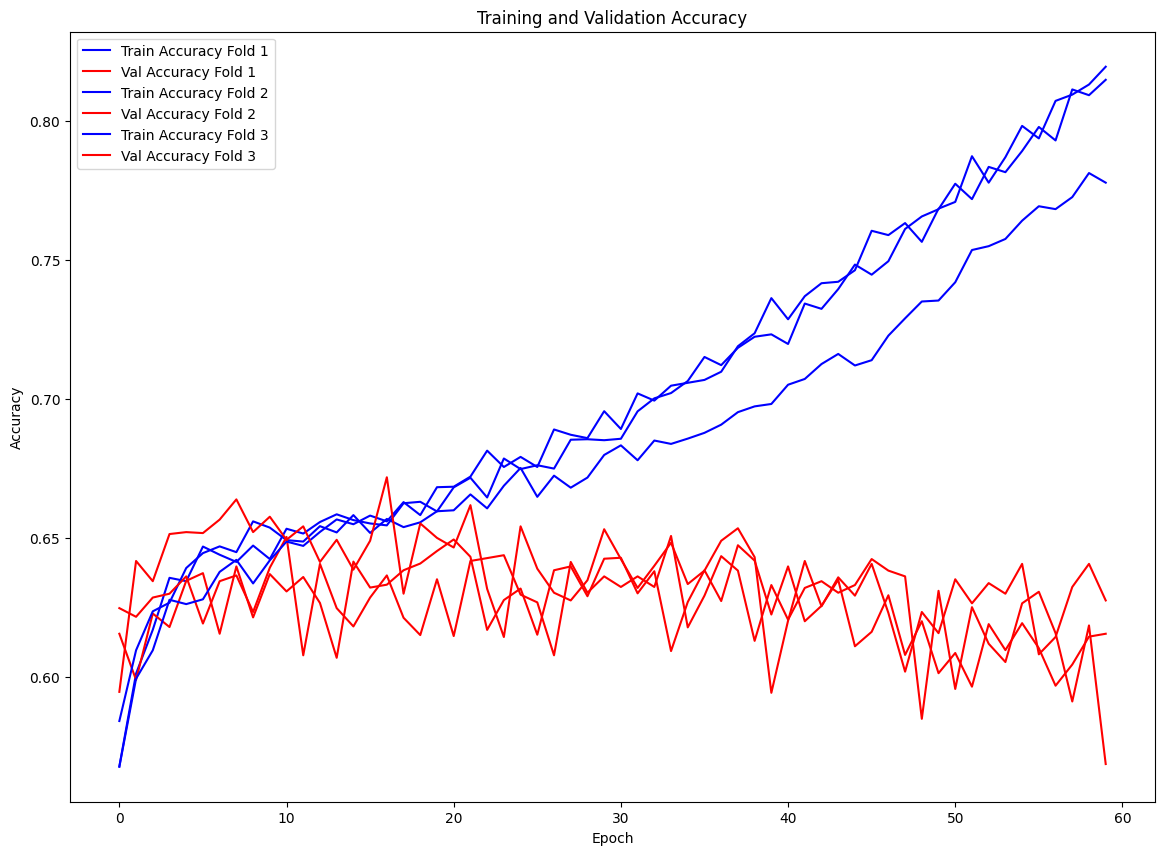
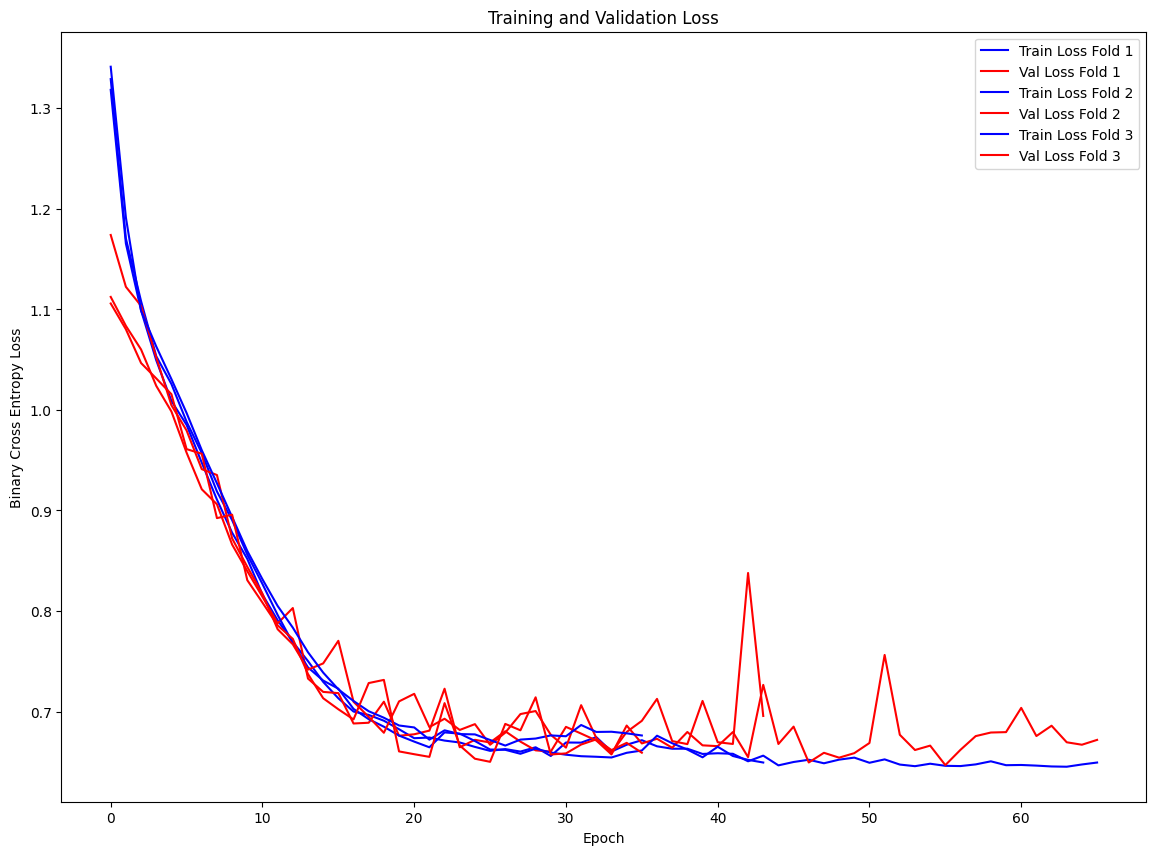
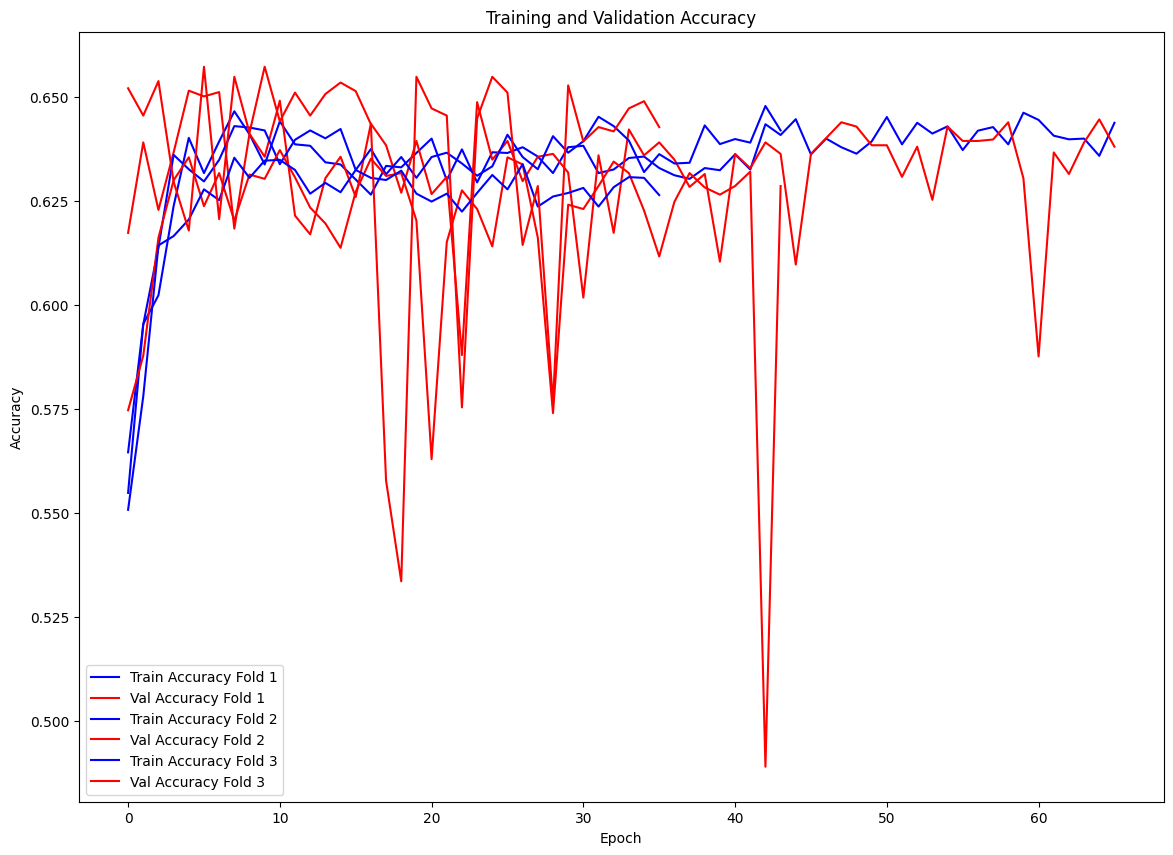
On the initial run, the model shows some serious signs of overfitting. Both the training and validation metrics improve until about epoch 10, but then the training metrics continue improving while the validation metrics decline.
I care especially about loss here – log loss penalizes the widely mis-fit probabilities of the model predictions, and since my application is more concerned with the probabilities than completion predictions, I want to monitor the loss function closely.
Proposed Solution (Model Selection) w Regularization
I eventually settle on a final model (by lowest avg loss score via 3-fold CV) that implements the following regularization techniques to discourage overfitting:
- All non-output layers are L2 (ridge) regularized, which penalizes large weights in the network and encourages simpler models.
- More aggressive (.6) dropout before the output layer - by randomly dropping more neurons during training the model is less able to attach itself to noise from the training set.
- Early stopping prevents the model from continuing to train after val loss has not decreased for 10 epochs. The model is also then restored to the weights from the run with the lower val loss.
The model performs better than in the original approach – the dropout and L2 regularization help the model not overfit as fast and allow validation loss to continue improving through the ~50th epoch, and the early stopping stops training once the validation loss stops improving. The model does not learn an overwhelming amount, likely due to the uncertainty in the nature of the problem.
Results
Accuracy
After implementing the regularization techniques outlined, the final model accuracy on the holdout test data was .635, an improvement on the original model by .04 and an improvement on baseline accuracy by > .02 .
The interpretation is that the model can predict with 63.5% accuracy which passes were completed at the time they were thrown in weeks 7 and 8 of the 2021 NFL season.
Learnings
- As I suspected, achieving high model performance is difficult given the uncertainty in each passing attempt.
- More data would almost certainly help the model’s performance – having less than 7,000 plays to learn from constrained the model’s ability to learn from player positional and speed-related patterns. Situational/historical player data may also help determine pass completion rates.
- Through this project I learned how neural networks can be very sensitive to the training parameters used – each new approach I took to tweak the model often drastically changed the results. – I tried increasing/decreasing model complexity, implementing class weights, changing batch size, etc. None of it had an appreciably large impact on improving model performance.
Results Visualized
One of the most unlikely completions occurred on this play, when Patrick Mahomes completed a 25 yard against the Titans in week 7 of the 2021 season:
I hypothesize the model judged this play as unlikely (44% prob of completion) for a few reasons:
- Mahomes was moving away from the angle of the throw
- There was a defender between the ball and intended receiver
This play illustrates why Mahomes is so talented – he can complete passes that would be otherwise unlikely for the average quarterback to complete.
Future Work
- In future extensions of this project, I will explore if any other features affect pass completion, like down, time remaining in game, etc. With more data I would also like to create more comprehensive evaluations of quarterbacks by completion difficulty across seasons.
- I would also like to apply this same framework to predicting quarterback sacks, and identifying which were the plays that had the highest chance of a sack that the quarterback escaped.
- This CNN application to player tracking data could be applied to all sports – for now American football is the only sport with any significant public tracking data. Soccer, hockey, and basketball are all fluid sports with dynamic movement that could benefit greatly from being analyzed in this manner.